Find out everything you need to know about your Freemium environment in this article.
Table of contents :
1.  5 minutes to figure it all out!
2. The navigation
a. The app bar
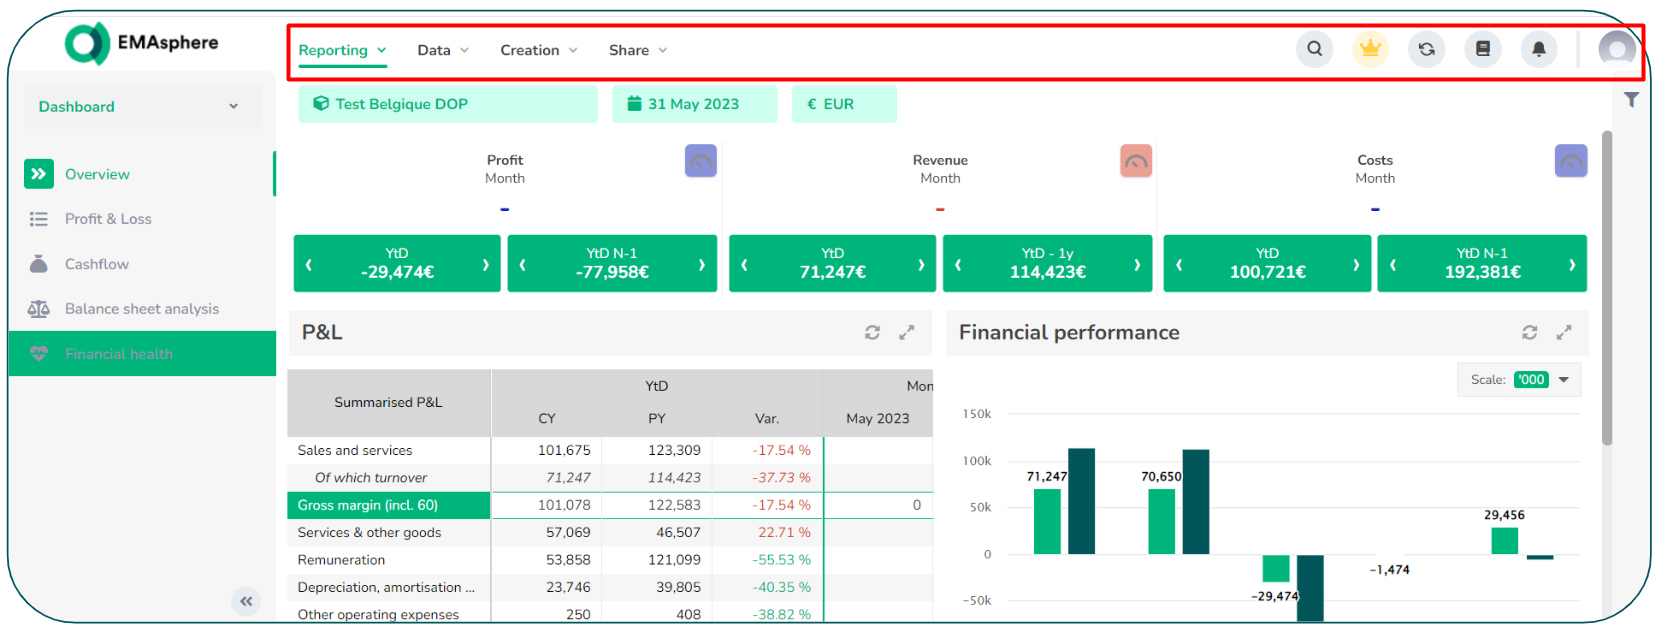
It is located at the top of the screen, both on the Dashboard and on any page in your environment.

On the left-hand side of the bar you will find the applications :

| Reporting | This application contains the menu of your environment. |
The following 3 apps bring together sections that are only available in Premium subscriptions. This gives you an overview of the many features offered by EMAsphere.
| Creation | This application groups the different sections related to the creation of your environment. Depending on your subscription, you can find sections that allow you to create tables, charts, KPIs and slide decks. |
| Settings | Here you will find the different sections for setting up your environment. Depending on your subscription, you can find the sections that allow you to manage the analytics, account categories, financial years and operational data flows (non-accounting data). |
| Share | This application allows you to manage your users and access right. |
![]() If you wish to open a section in a new tab, right-click on it.
If you wish to open a section in a new tab, right-click on it.
On the right side of the app bar, you will find a search bar and various icons:

 |
Search bar: allows you to search directly for a section in the various application. Move your mouse over the icon or use the shortcut CTRL+SHIFT+F to expand the search bar. |
 |
Premium icon: represents the features included in Premium subscriptions |
 |
Refresh icon: this refreshes the dashboard page. This function is useful, for example, to check whether the data has been updated after an import or a change in the configuration of your environment. |
 |
Help Centre: Got a question? The answer is probably in the Help Centre! Click on this icon to access the documentation. If you do not have access to the Help Centre, contact the support team: support@emasphere.com, an activation link will be sent to you. |
 |
Notifications icon: This icon gives you access to your notifications. You can set your notification preferences in the User settings section. |
 |
User settings icon: Here you can manage your profile, account and notification preferences |
![]() For more information on user settings: click here
For more information on user settings: click here
b. The context bar
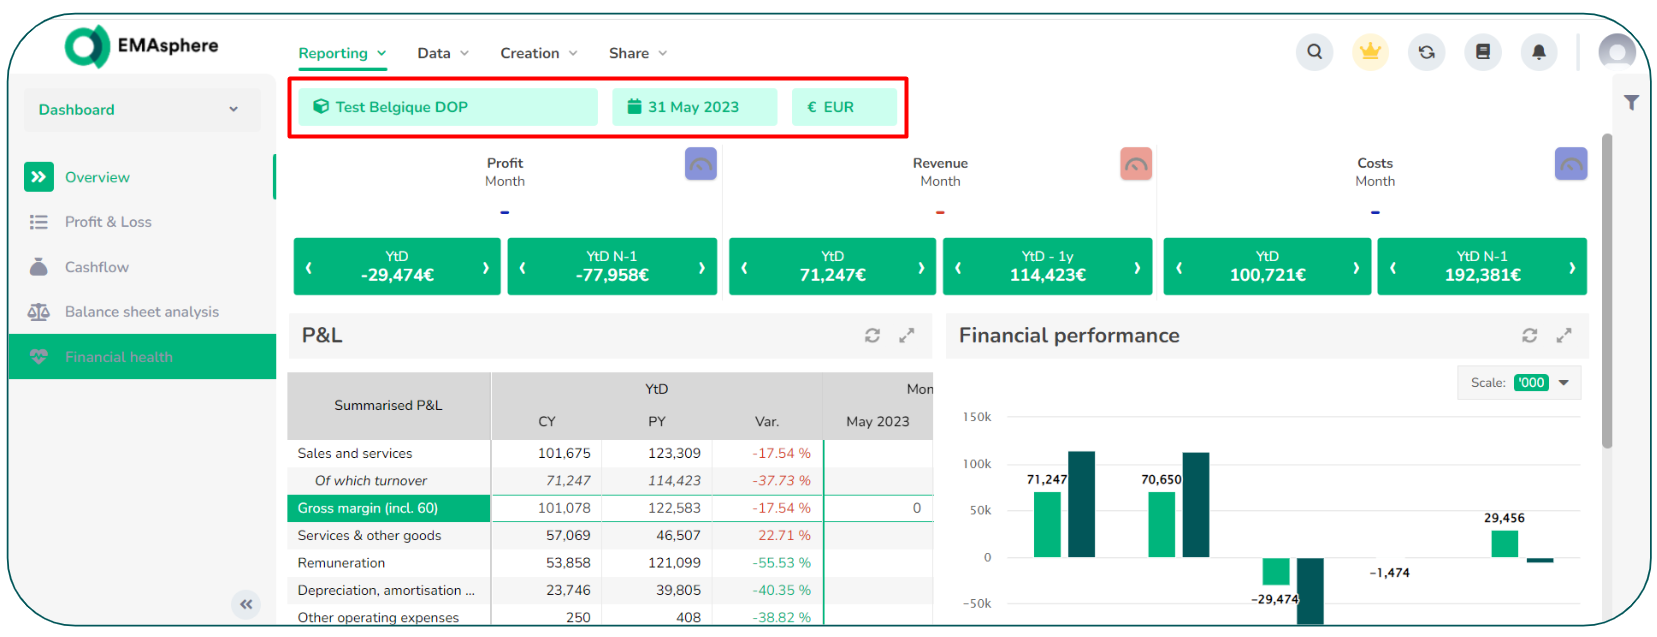
It is located at the top of your screen, below the app bar.

The context bar contains the following components:
| Icons | Functions |
 |
The name of the entity |
 |
Date on which data is displayed |
 |
The currency of the entity |
c. The menu bar
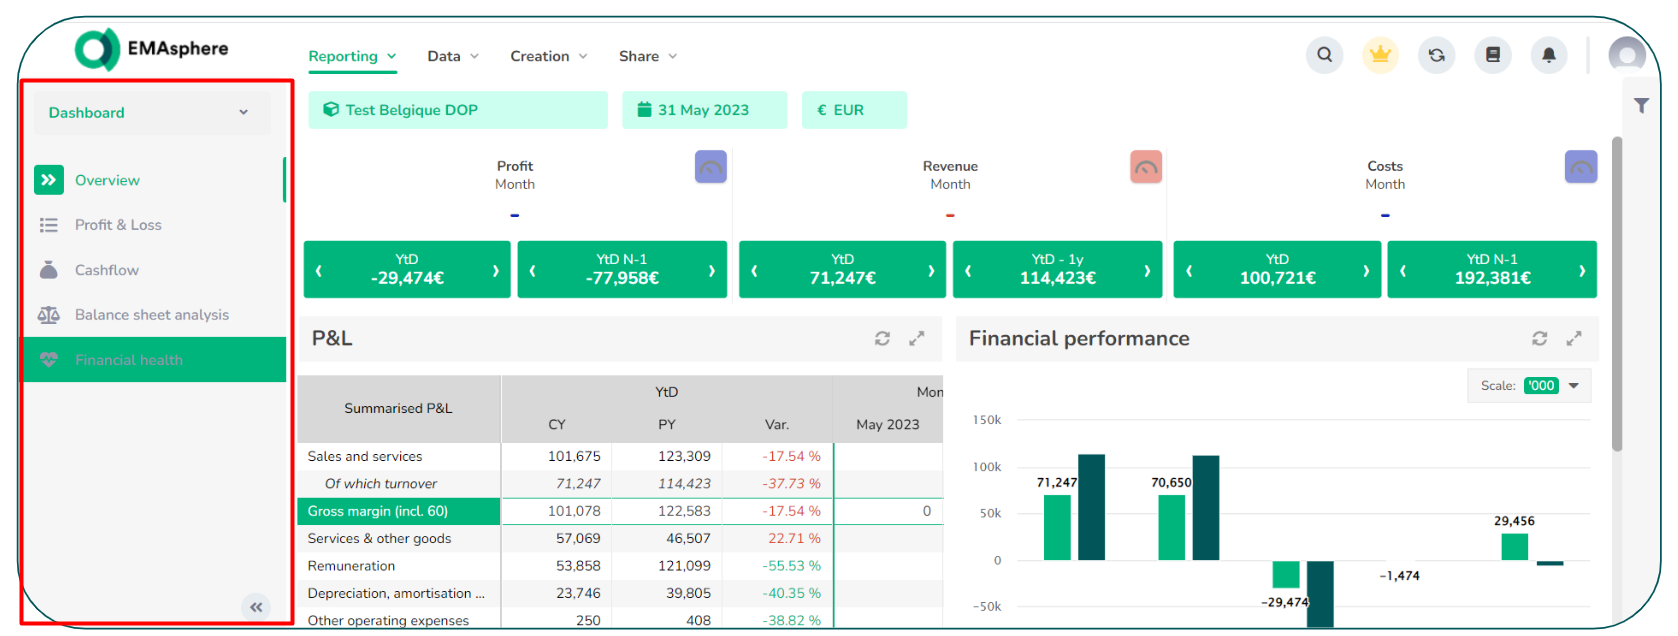
It is located on the left-hand side of your screen.

The menu bar contains the following options:
 |
Display the list of menus |
 |
The menu's sections |
 |
Reduce the size of your menu bar |
 |
Expand the size your menu bar |
d. The right sidebar
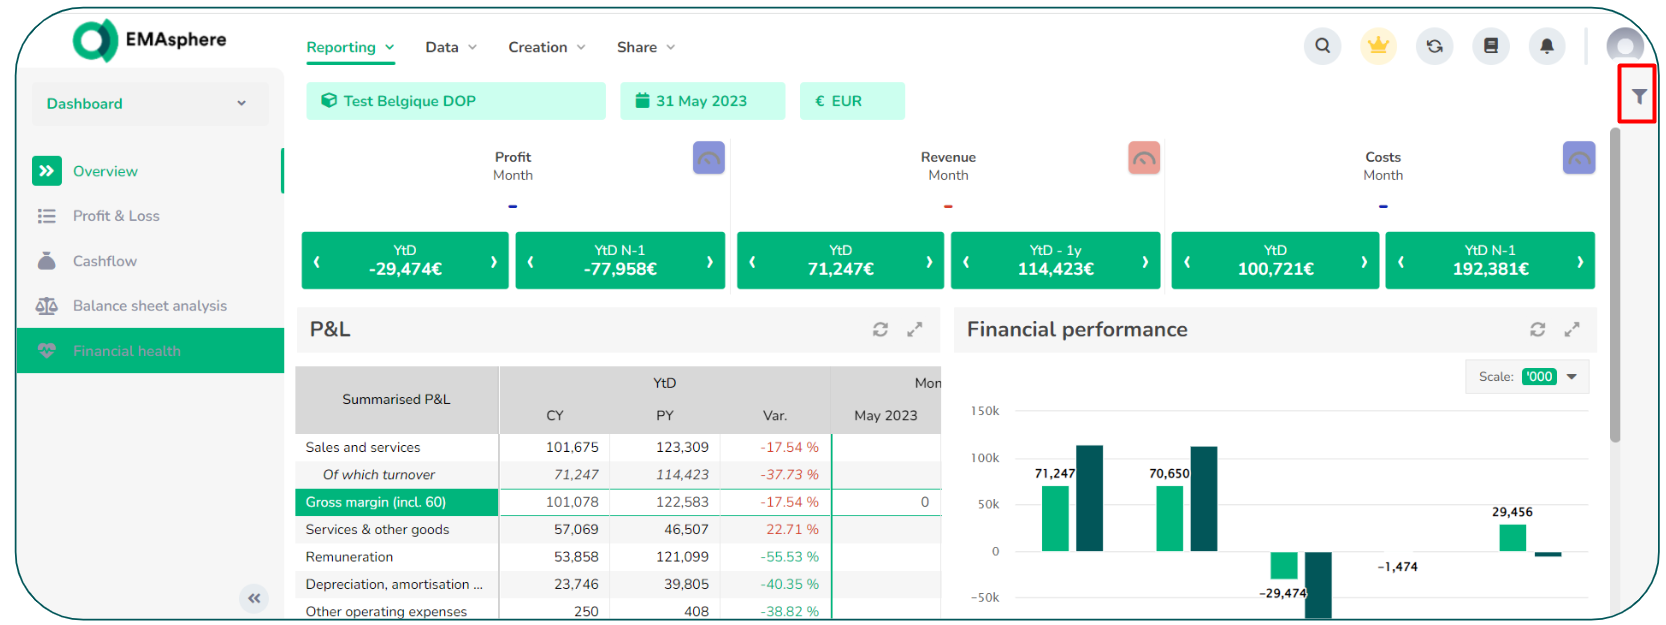
It is located on the right-hand side of your screen:

The right sidebar contains the following icon allows you to apply filters by page
3. Other icons and abbreviations
a. Other icons
|
Icônes |
Fonction |
|
|
Expand grid or chart |
|
|
Collapse grid or chart |
|
|
Refresh the page. |
|
|
Group figures by the thousands or millions |
|
|
Function for hiding columns selected via the drop-down menu |
|
|
Function for hiding empty rows in a table |
b. Abbreviations
| Abbreviation | Definition |
| Temporal Abbreviation | |
| YTD | Year-to-Date |
| FY | Full Year |
| EoM | End of Month |
| CY | Current Year |
| LY | Last Year |
| LM | Last Month |
| PY | Previous Year |
| Mth | Month |
| FE | Full Exercise (= financial year) |
| Q | Accounting Quarter |
| L12M | Last 12 Months |
| RoY | Rest of Accounting Year |
| CQ | Civil Quarter |
| LstDCMth | Last Day of Month |
| MthTod | Month to Today |
| SDay | Selected Day |
| Tod | Today |
| YTod | Year To Today |
| Other Abbreviation | |
| GM | Gross Margin |
| P&L | Profit and Loss |
| Var | Variation |
4. Premium features
You have discovered your Freemium environment and would like to go further in the use of EMAsphere? Find out here about all the features available in the Premium versions of EMAsphere.
a. Consolidated reporting
Your version of EMAsphere allows you to analyse data from a single entity.
If you have several entities, the platform can also automatically generate a consolidated reporting. This gives you a view on a group basis or entity by entity.
Among other things, EMAsphere lets you manage several currencies, different charts of accounts and generate a table for eliminating intercompany balances.
b. Forecast
We have developed tools to support you at every stage of the budgeting process, from a 5-year overview to very precise forecasts.
You can create different types of forecast to help you anticipate changes in your performance over the short, medium and long term.
Top-Down-Forecast
- Get a high-level view of your company's future.
- Simulate different forecast scenarios and see the potential impact on your data (sales, cash flow, working capital requirements, etc.) in real time.
P&L Forecast
- Define in detail your forecast P&L for the coming months or year. You can start from a previous budget or from scratch.
- Easily create Reforecasts if your company's situation changes.
Cash Forecast
- Anticipate your cash requirements or investment opportunities using the Cash Forecast.
- Update your forecasts and automatically see the impact in the Cash Flow table.
c. Customised configuration of your environment
You have the option of customising your environment.
Firstly, by creating different menus. You can share these menus with different people, depending on what you wish to communicate or not.
Secondly, you can create your own tables: from the income statement table to the intercompany follow-up table, as well as the table with an analytical view, etc. You can create any type of table in EMAsphere.
You can also create new charts tailored to your business! Bar charts, diagrams, histograms, waterfalls, radar, pyramids, etc. Dozens of different charts are available and can be customised.
You can also choose KPIs from the EMAsphere catalogue or create your own. KPIs allow you to see a figure at a glance, compare it with previous months/years, and with what has been budgeted.
Enjoyed the preview of these features? Don't hesitate to request a demo online.
You are ready to use EMAsphere !


