Advanced features designed for your analysis
Consolidation, cash flow, analytics, forecasts, multiple systems, drill down, ... Discover all our features.
Intercompany management integrated into the platform
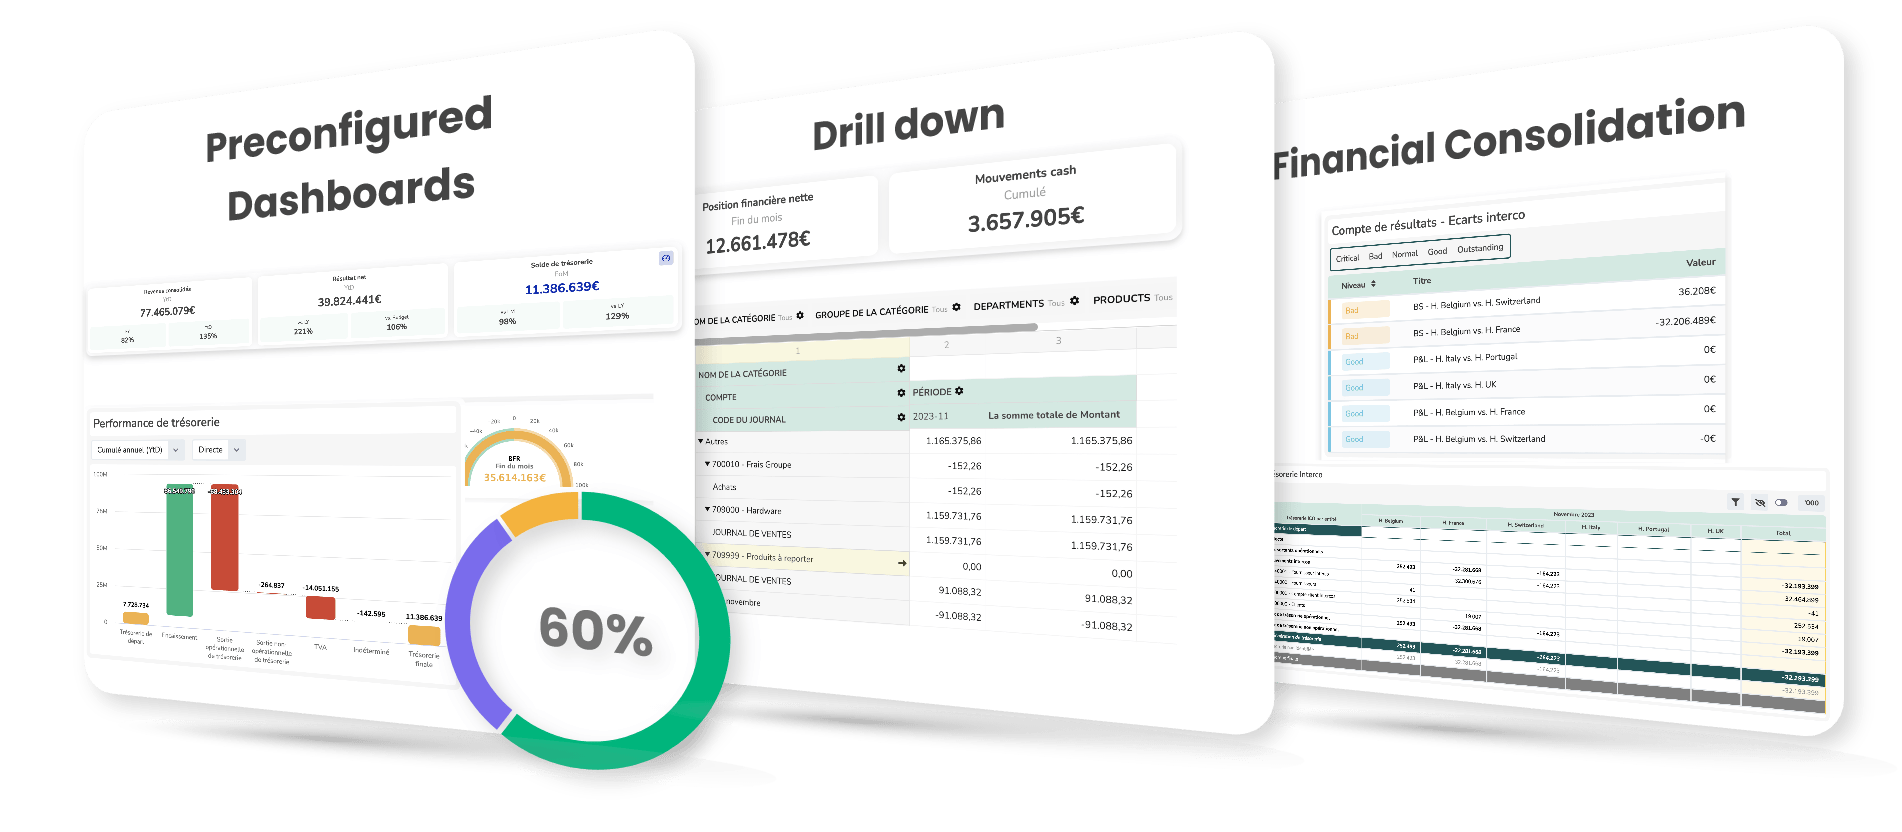
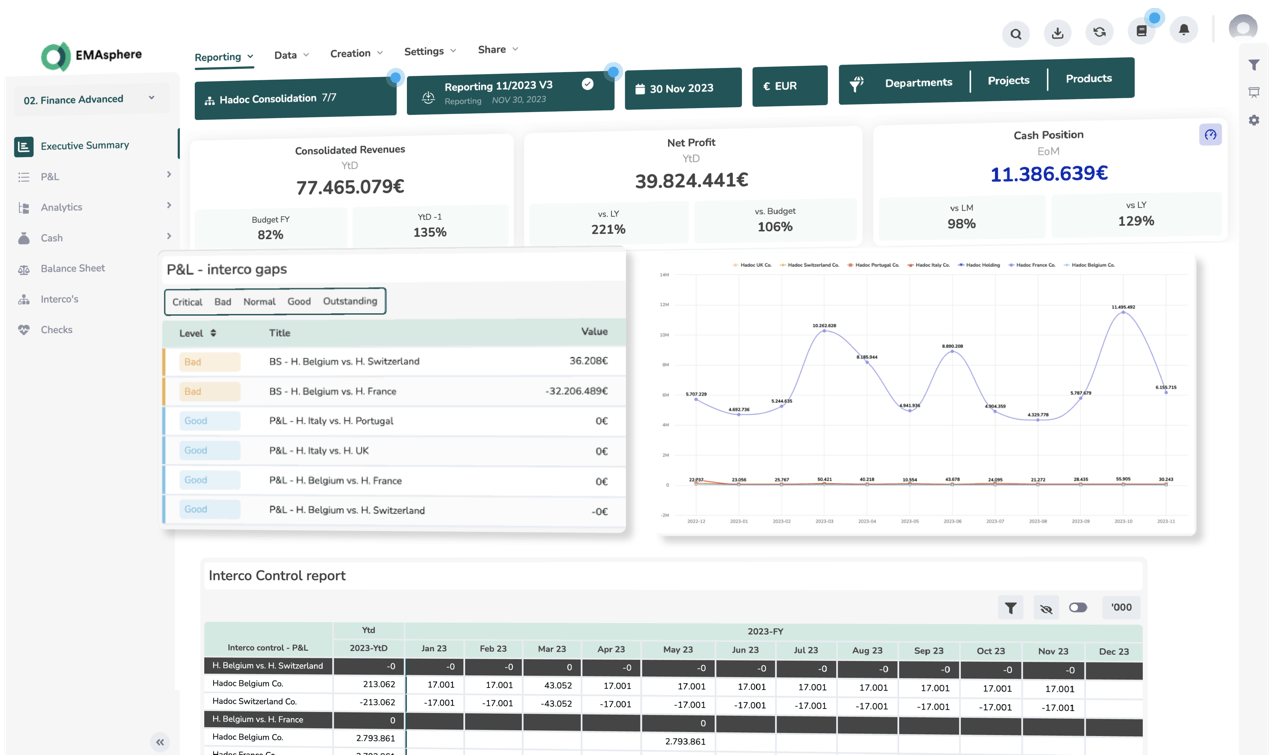
✔︎ Obtain your group's result by automatically filtering out intercompany transactions from your analyses.
✔︎ Easily perform consolidations for your income statement, cash flows, balance sheet, and receivables/payables thanks to the intercompany tables.
✔︎ Finalising your consolidation (eliminating investments, goodwill, etc.) directly in EMAsphere is also possible.
Multiple charts of accounts and different currencies
✔︎ Whether you have different accounting systems or charts of accounts, in EMAsphere they are standardised to facilitate analysis and ensure data reliability.
✔︎ Manage all your currencies and choose the most appropriate exchange rate calculation: average rate, closing rate, budget rate, or reporting rate. The platform generates automatic entries for differences between closing rates and average rates.
Sub-consolidation: analyse entities by group
✔︎ These sub-consolidated views enable you to identify performance differences within your entities.
✔︎ Find intercompany transactions related to each sub-consolidation in a ready-to-use table.
Consolidated forecast: anticipate the development of your group
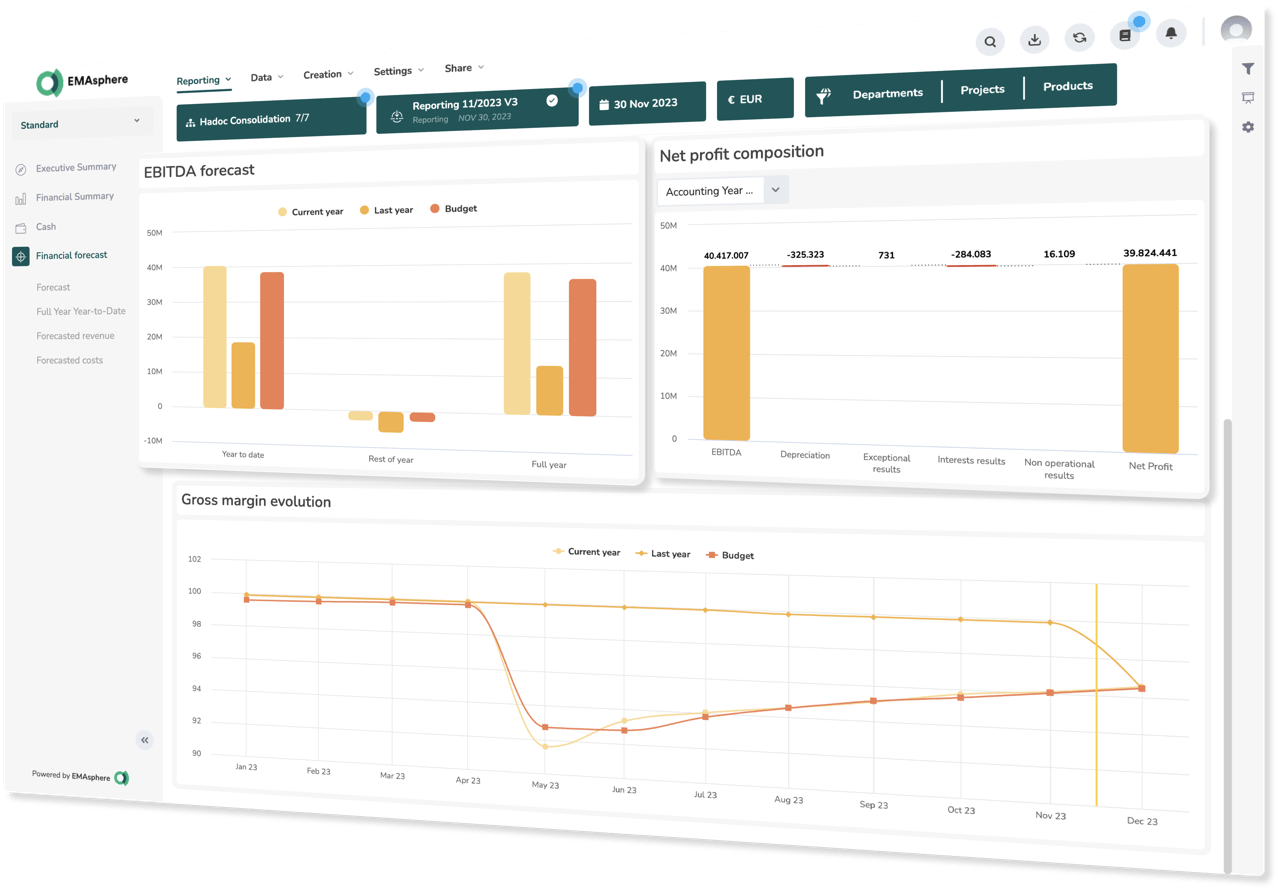
✔︎ Easily create your consolidated income statement forecast.
✔︎ Obtain a consolidated cash flow forecast.
✔︎ An essential tool for business management in times of economic changes, allowing you to create scenarios and make necessary adjustments for your group.
Analysis of your company's cash position
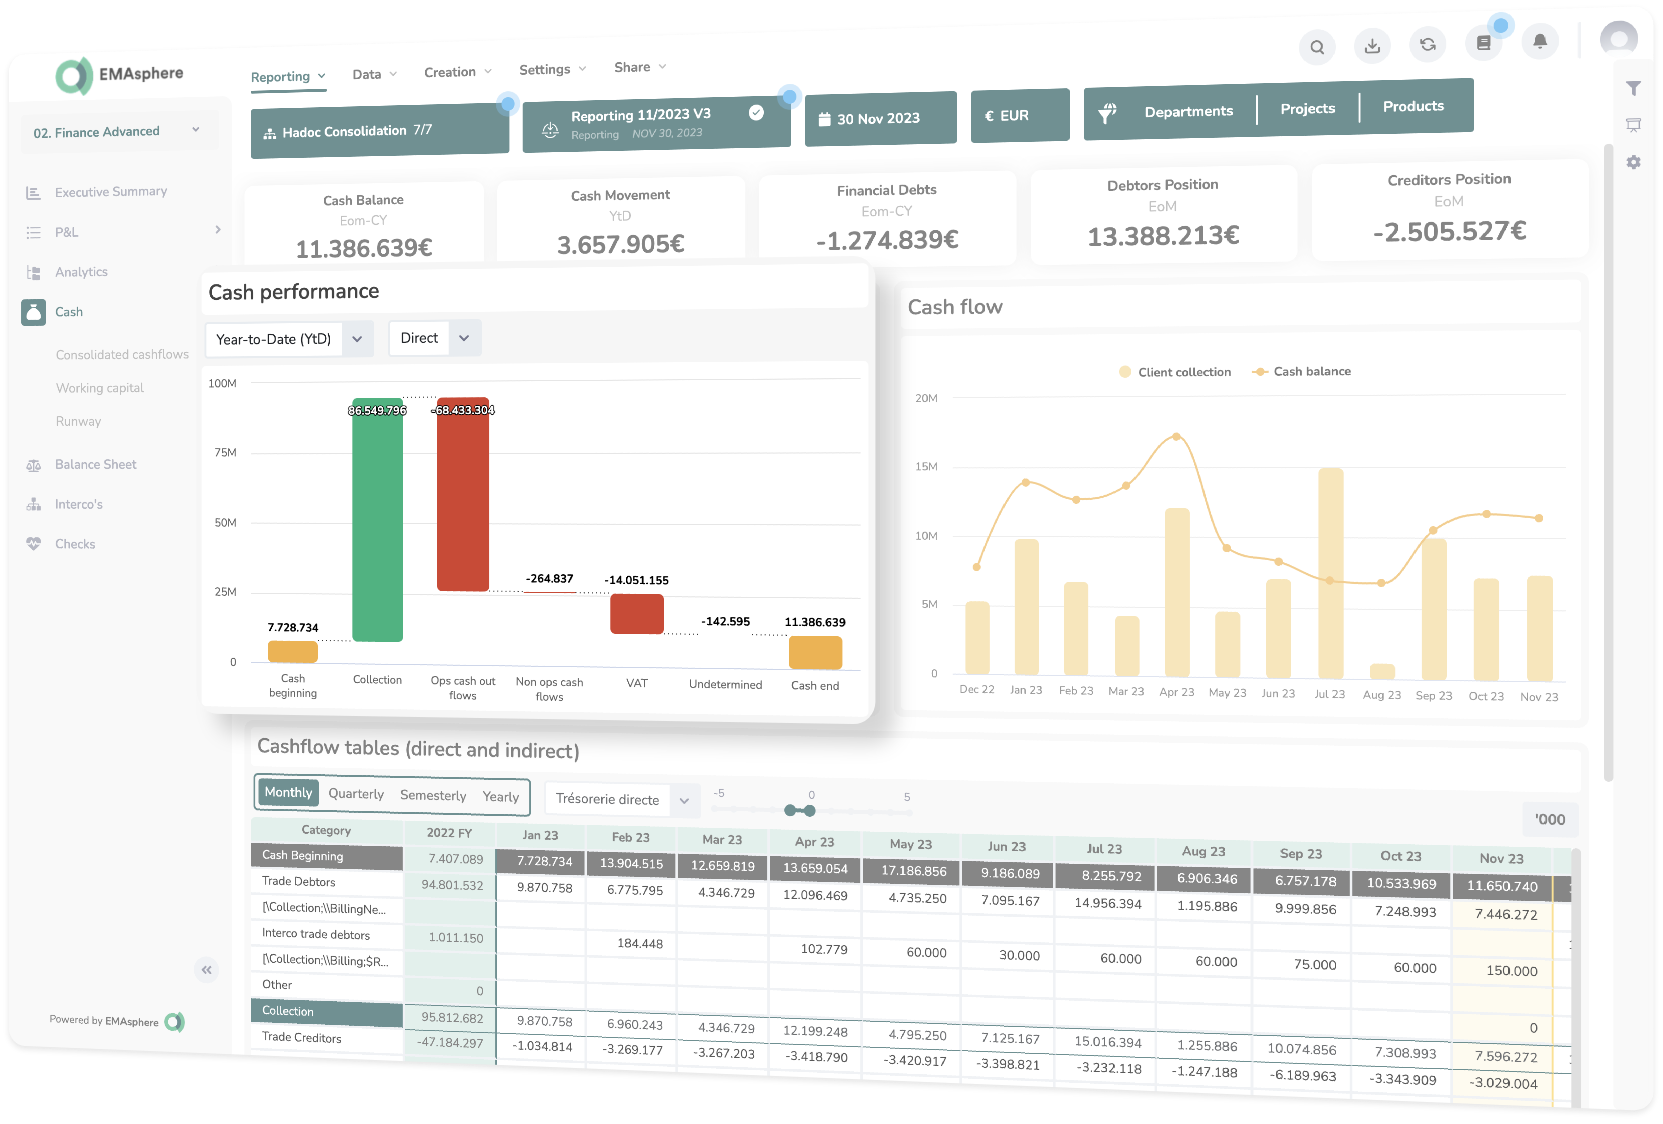
✔︎ Analyse the movements between the opening and closing values of your cash position (impact of your working capital requirement, financing, investments,... ).
✔︎ Analyse the KPIs, charts, and tables related to cash flow (such as investments, accounts receivable balance and DSO, financial debts,... ) which are automatically generated in EMAsphere.
Track the evolution of your cash flow
✔︎ Visualise the evolution of your cash flows monthly in an automated report.
✔︎ Analyse your cash inflows and outflows (payments and receipts) using the direct method.
✔︎ Analyse the evolution of your working capital requirement (movements in accounts receivable and payable positions) and your financing using the indirect method.
Create cash flow forecasts
Integration of your bank flows (with Isabel Connect)
✔︎ View all your bank balances from your various banks.
✔︎ Don’t wait for the accounting update to analyse your bank flows; enjoy automatically and daily updated dashboards within EMAsphere.
Create budgets in EMAsphere
✔︎ Create budgets in EMAsphere from scratch, based on a fiscal year or via an import (Excel), with or without analytical data.
✔︎ Monitor your budget and compare your actual results with your budget throughout the year.
Financial simulations (top-down forecasts)
✔︎ Obtain a high-level overview of your company's future.
✔︎ Simulate different future scenarios and visualise in real-time the potential impact on your data (revenue, cash flow, working capital requirement, ...).
✔︎ Create a financial plan for up to 5 years (income statement, cash flow, and balance sheet).
Track P&L forecasts
✔︎ Accurately define your P&L forecast for the coming months or years. You can start with a previous budget or from scratch.
✔︎ Easily create new forecasts (reforecasts) as your company's situation changes and/or if you work with rolling forecasts that need to be updated regularly (e.g., monthly).
Anticipate the evolution of your cash flow with cash flow forecasts
✔︎ Anticipate your cash needs or investment opportunities using cash flow forecasts.
✔︎ Update your forecasts and automatically visualise the impact in your cash flow statement.
Discover an overview of the other features of the platform
EMAsphere is an all-in-one platform for advanced data-analysis.
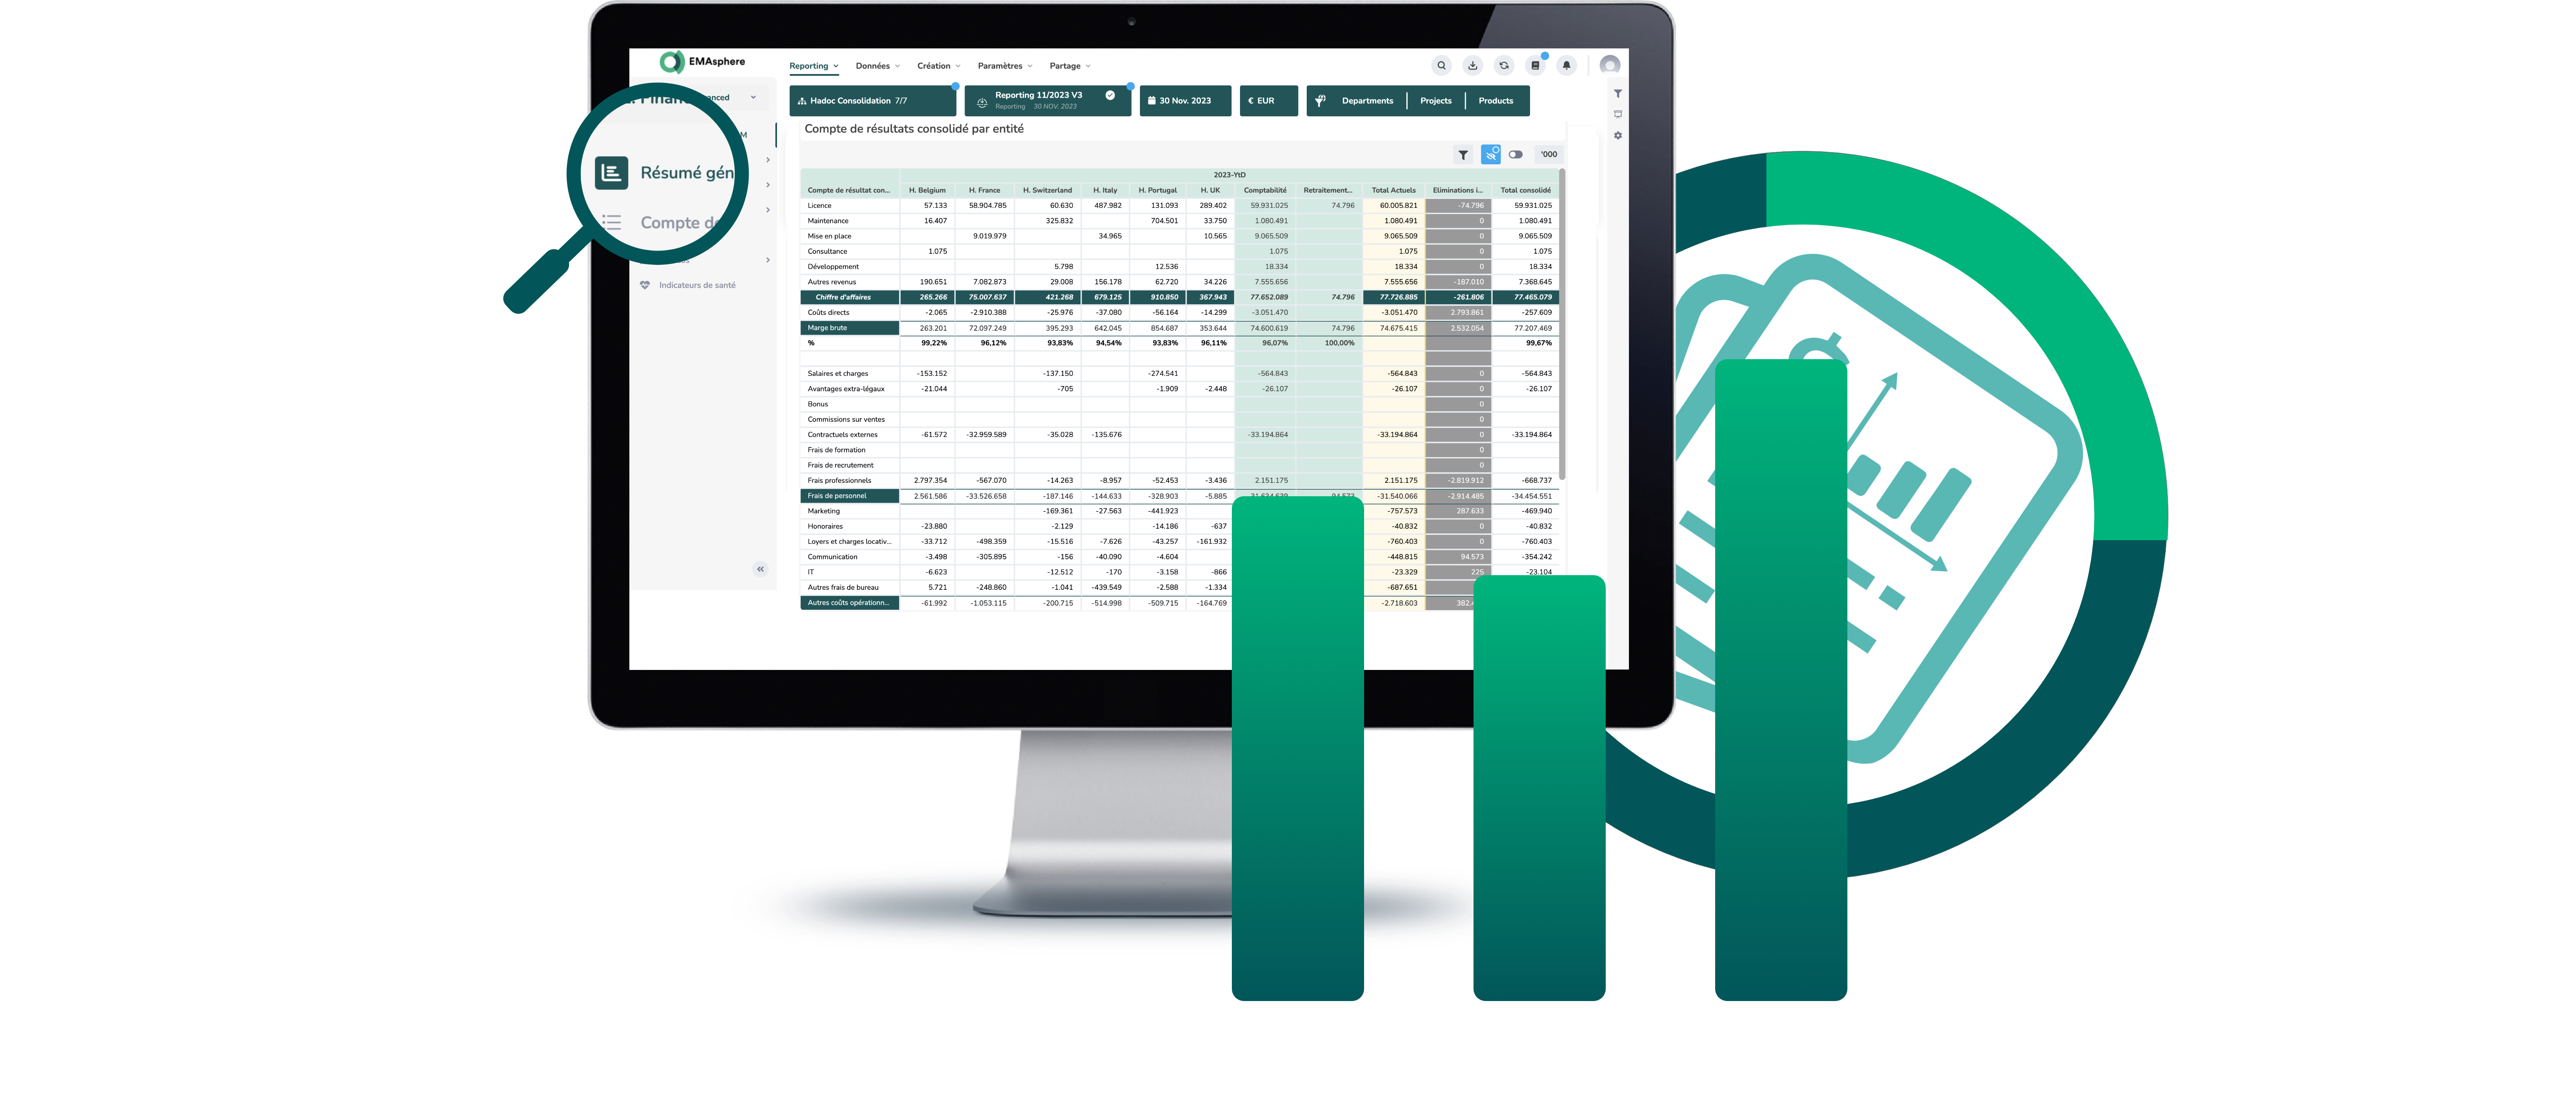
Analytics reporting
Refine your financial analysis by integrating various analytical dimensions in EMAsphere.
Multisystem
Cross-referencing data from multiple sources (accounting and operational).
Drill down
Double-click on your charts and KPIs to zoom in to the source data (journal entry or even the invoice). Perform dynamic pivots within the drill downs as well.
Data sharing
Share your reports with different stakeholders. Access rights can be customized per user. EMAsphere is also available in 6 languages. Your dashboards can automatically be translated by our AI.
Warnings
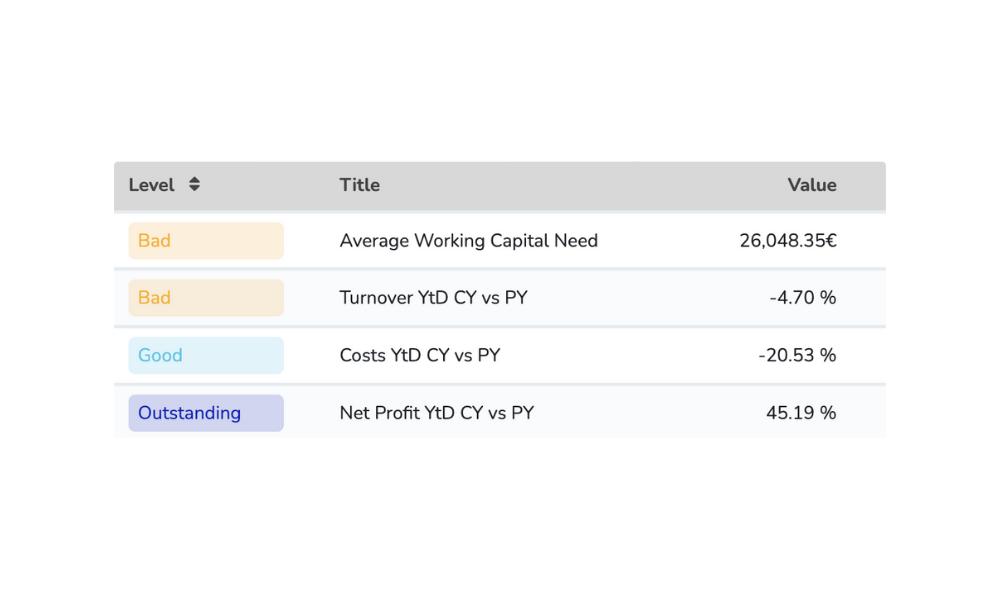
Receive alerts when a KPI exceeds a certain threshold. You can also generate an audio version of a KPI report that you can share.
Archives
The information is archived so you can return to a specific situation at any time on a given date (for example: report presented to the board of directors in October).
+ 250 integrations available with your favourite business tools
Easily connect your tools with EMAsphere
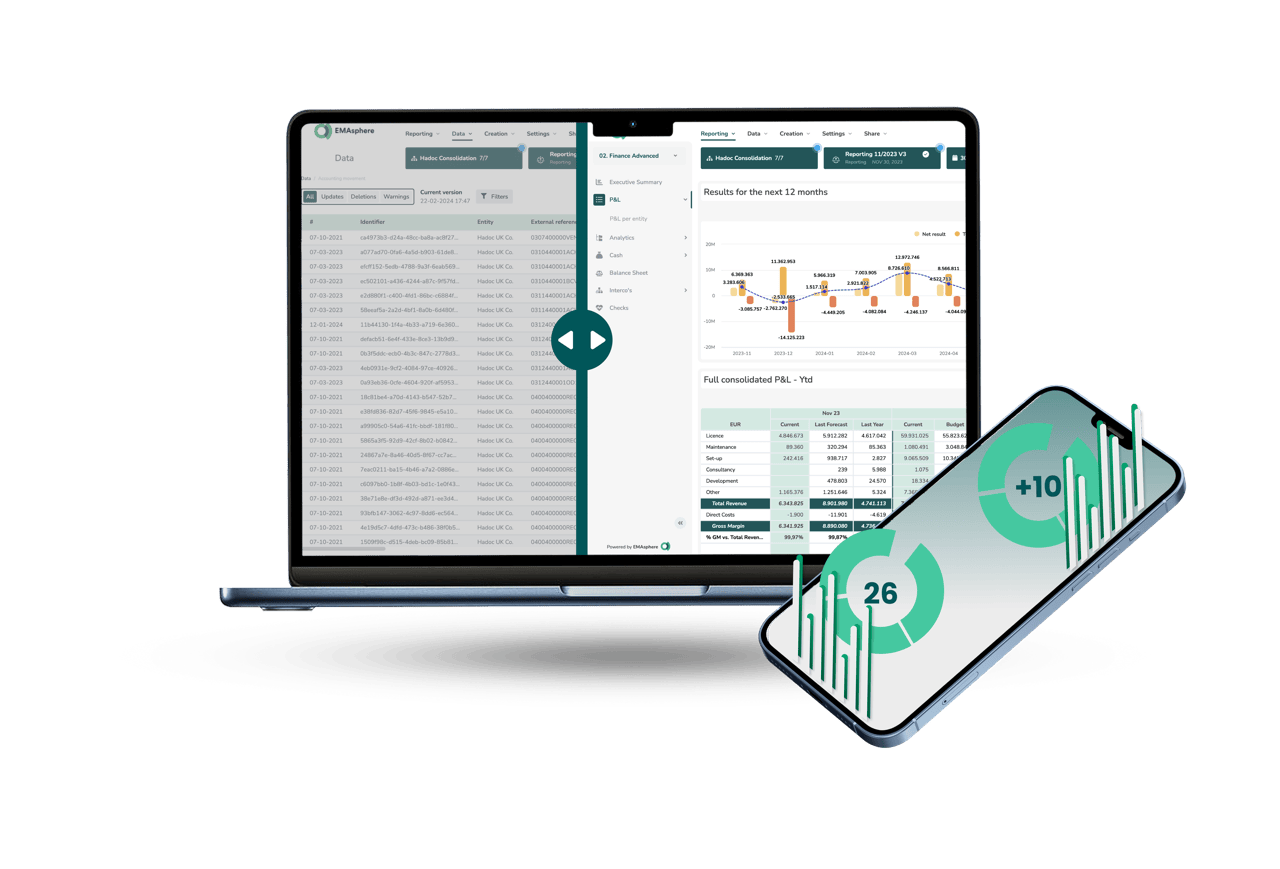
Visualise your data in just a few clicks with our unique technology.
Our unique data model allows you to collect, structure, enrich, visualise, and share financial and non-financial data. Communicating your financial information has never been so easy.
“EMAsphere pays for itself with the hours it saves me in Excel"
"When we set up a subsidiary and needed to start consolidating, Excel became difficult to manage. In EMAsphere, on the other hand, it's very easy to merge the data from both entities and view the French and Belgian reports. That's really where the transition shows positive results."
Arnaud Delmarcelle, external CFO of Saper Vedere
Take control of your data
Make your life easier with reliable and intuitive financial reports: from data collection to data sharing.
Book a personalized and obligation-free presentation of our software.

